


Blog Article
Your App's Live Report – Your Success at a Glance
Having an app is essential for modern businesses today. Having control over all aspects of it is just as important. With your app’s live analytics, you have that control. We’ve made success measurable for you.
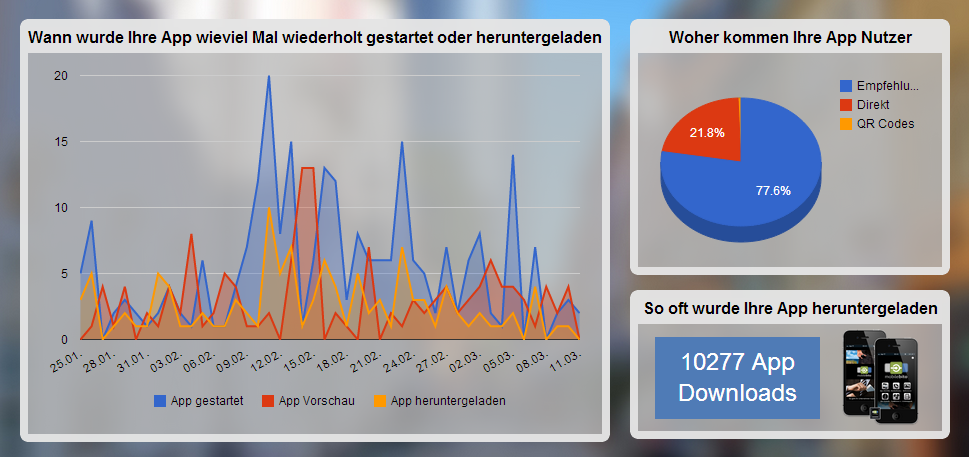
The statistics show you how often the app has been used over the past 45 days and how many customers have downloaded it. You can also see where your customers are coming from and how many times your app has been downloaded in total since its creation.
Here’s how to read the charts:
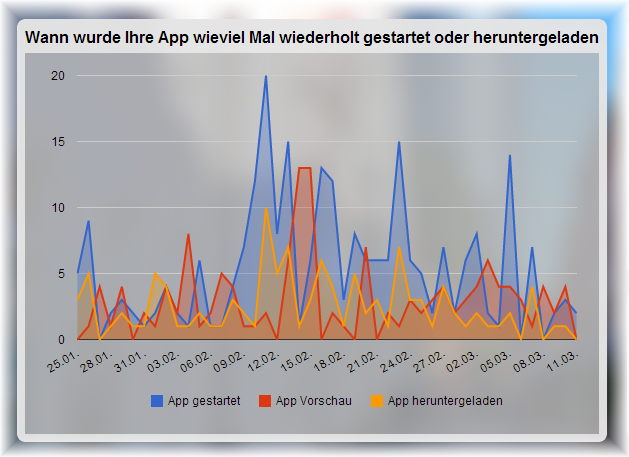 |  The blue line shows you how often the app was used that day.  The red line shows how many customers viewed the app preview.  The orange line represents the number of new app downloads on that day—in other words, how many new app users you gained that day. |
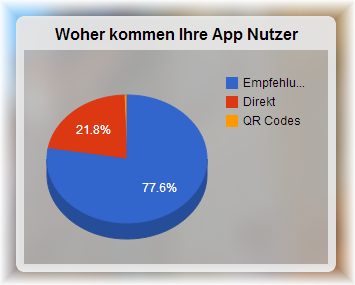
The pie chart – How your customers found the app:
In the top right corner under “Where do your app users come from,” you can see how your customers downloaded the app. Either through recommendations, directly via the link or download from the Play Store and App Store, or via a QR code. Recommendations means that you or someone else shared a link to the app online—for example, via a Facebook post or a link on your company’s website—and new users found the app directly through that link.
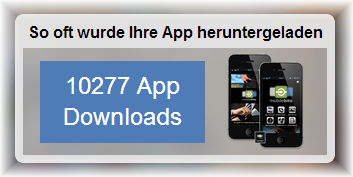
Total App Users
At the bottom right of the App Management overview, you can see how many times your app has been downloaded in total. This tells you how many of your customers you can reach through your app.
It’s also exciting to track how customers react directly to your actions. Why not launch a spontaneous promotional campaign? For example, with a coupon that arrives as a PushPlus notification to your customers, and see how the statistics improve.
Click here to go directly toApp Management. There, you can simply click on “Live Report” in the top right corner to view the statistics.
Do you have any requests or suggestions? We look forward to your comment ormessage!